
– June 2011
Highlights
- The year ahead looks bright. 66% of exporters expect an increase in export orders – just slightly less optimistic than 8 months ago.
- The largest value of exports by a company participating in the National Exporter Outlook Survey was $600 million revenue in the past year.
- More than half of participating exporters export more than half their output.
- 23% of the companies participating in the Survey export virtually all (91 -100%) their production.
- The average export income earned by participating companies was 60% (59.78) of production.
- The total value of exports of participating companies was $3.18billion
- The average amount earned from exports by participating companies was $18.48 million
- South East Asia including China has overtaken the US and UK/Europe as the second biggest export destination for kiwi goods after Australia. This has occurred since the last National Exporter Outlook survey in November 2010.
- The volatility of the exchange rate is the biggest obstacle to growing exports.
- Exporters expect the Government to assist them; the most popular way nominated was assisting with overseas market development.
Orders expected to rise. Dollar dampens margins
About half of our exporters are expecting profits will improve in the year ahead with another 36% thinking they will stay at the same level. The remaining 15% expect some deterioration.
The findings from Export New Zealand’s National Exporter Outlook Survey conducted in early June represent a slight slip back from the position in late 2010 as more exporters now expect profits to hold steady.
Nearly half the respondents (47%) identified exchange rate volatility as the key obstacle preventing them from exporting. or exporting more than currently.

Nonetheless two thirds of exporters see better times ahead.
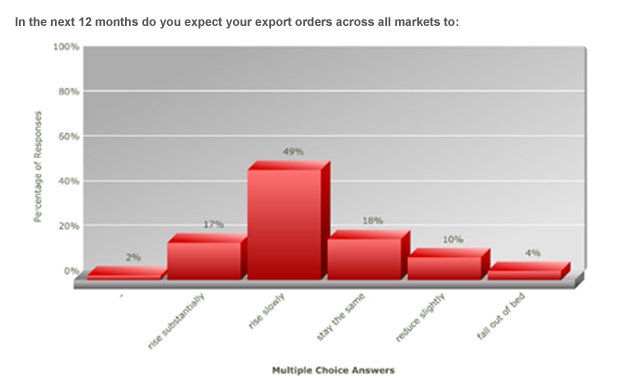
Traders expect orders to rise significantly in the 12 months ahead; 17% are looking for a substantial rise, and 49% expect slow gains, which is slightly less optimistic than 8 months ago.
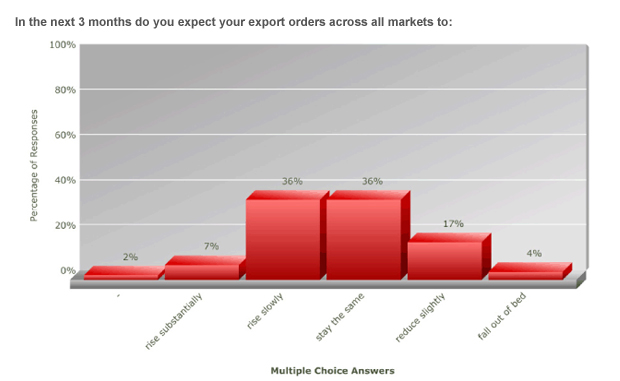
Gains in the short term are less certain. In the three months ahead (till September) respondents expected export orders across all markets to remain as they were six months ago. 36% expect the same level with a further 36% expecting a slow rise. 17% forecast a slight reduction. Just 7% expect a substantial rise and 4% a substantial decrease.
Obstacles to export growth
The ranking of the issues preventing exporters from earning more offshore closely matched those last November when the Survey was initially run.
After exchange rate volatility, the second biggest obstacle to expanding exports was price competitiveness of products (38%) followed by a lack of offshore demand (28%).
For 23%, the cost of raw materials and/or components was proving a barrier.
The next most critical concerns in order of importance were:
- Funding for developing export markets (21%)
- Freight costs, including ‘distance to market’ (18%)
- Overseas regulatory requirements (7%)
- Lack of export skills/knowledge (6%)
A long list of one off barriers was penalizing respondents including in-house capacity and capability; availability of debt finance; and length of lead time in delivering goods.
Regulatory barriers in NZ
Regulatory barriers within New Zealand are reported to be hindering some exporters. These factors included:
- NZ Government organisations such as NZ Food Safety Authority is identified as frequently changing its requirements and taking too long to respond to exporters request for information.
- Immigration requirements preventing access to key skills or students, and slow processing of applicants medical reports.
- NZQA compliance costs said to be huge in terms of time and money.
- Slow planning approval processes by New Zealand councils, and which can add up to 30% to the cost of installing new production plant.
- Border controls between New Zealand and Australia including phyto-sanitary requirements.
- Requirements of New Zealand Standards.
Can Standards help exporters?
Respondents had mixed views on the potential value of possibly developing standards common to multiple countries such as product safety and energy efficiency standards for all countries across the Asia Pacific. When asked if such standards would help reduce barriers to trade and cut compliance costs, about 36% said no and a significant 35% weren’t sure.
For the 30% that said yes, the benefits of common standards are held to be:
- Simplified market access with one common set of requirements for the registration of products
- Reduced need to tailor make for individual markets; reduced cost
- Reduced competition with those using cheaper ingredients without having to declare them on labels; levelled playing field.
- Easier transfer of know-how
- Recognition of distinctive properties and performance of New Zealand material
- Eliminating non-tariff barriers
- Reduced expense of testing and certification to enter new markets
- Improved control of intellectual property particularly within Asia.
- It would help with compliance inspections if we had to reach only one international Food Safety Standard (such as British Retail Consortium BRC Version 5 which is recognised in USA, Europe, and some supermarkets in Australia
Where government assistance is wanted
Respondents rated the importance of Government assistance similar to last November. Most urgent just now was assistance for developing export markets. 61% rated this highly, with 85% overall rating it high or of medium importance.
R&D rated second highest priority. 25% rated it of top importance. Least important was venture capital; rated highly for 13%, and of low importance for 54%.
The extent that a lack of capital was a constraint to growing respondents’ exports was rated as the biggest limiting factor by 16%, but 24% said it was no constraint at all, and 68% rating it of little or no constraint.
While business generally likes to keep a distance from Government, most think Government does not do enough to encourage exporting (65%), the same as wanting Government assistance.
Individual responses varied as to what the Government should do to encourage exporting ranging across:
- Market distributor funding
- More funding for new market development for smaller exporters
- Realistic depreciation rates; tax concessions for market exploration, and help with freight costs
- Achieving mutual recognition of franked dividend imputation with Australia
- Incentives for companies producing value added products in NZ for export
- Limiting the export of unprocessed logs
- Free Trade Agreements only with countries with similar labour laws, tax structures and currency controls
- Reduced taxation on export revenues
- Assistance with NZ presence at international trade shows
- Offering alternative types of funding eg, bridging finance, export insurance, subsidised staff training; funding for overseas promotion, web initiatives, grants to stock offshore, help to buy machinery.
- Low level small loans to assist SMEs, eg, to get to trade shows
- Get rid of the 50:50 funding ring-fenced limiting it to reimbursement; better to allocate a set number of hours for New Zealand Trade and Enterprise overseas staff to work on our behalf
- Bring in disincentives to exporting raw materials
- Broaden assistance to more than those operating in a high-tech field or glamour exports like farming/primary produce, wine, food and tourism
- Get rid of tariffs for NZ goods going into the USA, UK, Europe and India
- Employ the right people in overseas markets
- Do something, anything; just do something
- An exporting culture in the Government
- Impose a speculation tax on the NZD trade to reduce volatility
- Information on visiting trade delegations
- Provide (in-country) quality introductions, networking and mentoring
- More competitive shipping options
- Current export credit guarantee provisions are far too restrictive and narrowly focused
Government assistance
Please rank the following issues in their order of priority and importance for your business. Is Government business assistance most urgent right now for:
R&D |
Venture Capital |
Export Market Development |
|
| Highest priority | 45 | 23 | 109 |
| Medium priority | 76 | 25 | 43 |
| Least priority | 38 | 96 | 12 |
New markets
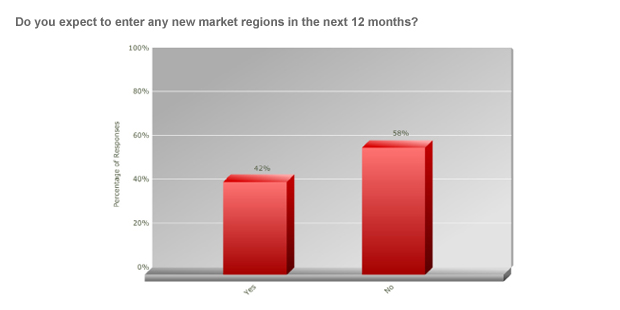
A slight majority (58%) don’t expect to crack new market regions in the next 12 months with 42% set to tackle new export destinations (compared to 44% 18 months ago) to a range of destinations traversing the globe.
All markets offer 100% growth for some exporters. China including Hong Kong is expected to offer the biggest potential for export growth (one firm anticipates 2000% growth!) with North America, North Asia and Europe expected to offer sound growth prospects.
What % growth do you expect in the following markets for your products/services?
Market region |
% growth |
| Africa | 16.29 |
| SE Asia | 21.11 |
| Australia | 19.7 |
| China (incl Hong Kong) | 41.93 |
| Europe (incl UK) | 23.13 |
| North Asia (Japan & Korea) | 26.57 |
| Middle East | 17.24 |
| North America | 42.6 |
| Pacific Islands | 7 |
| Latin America | 19.05 |
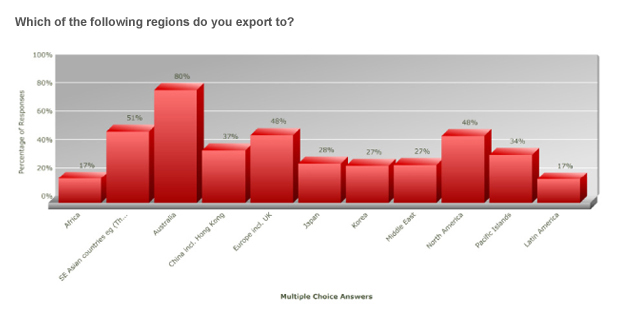
After Australia the most common export markets are South-East Asian countries, eg, Thailand, Indonesia, Malaysia, Vietnam and the Philippines (for 51%), followed by the US and Europe including the UK (both at 48%).
The next most popular destinations are China including Hong Kong (37%), the Pacific Islands (34%), Japan (28%), Korea and the Middle East (both at 27%) and Africa and Latin America on 17%.
And when it comes to bidding for Government tenders in Australia, 59% don’t think they get an equal opportunity despite CER rules.
Background
236 respondents in all participated in ExportNZ’s June 2011 National Exporter Outlook Survey Respondents operated throughout the country. 61% were manufacturers. 56% employed fewer than 50 staff, 32% had fewer than 20 staff, with 15% employing over 150 staff.
In the next 12 months staff levels are expected to stay the same (for 50%) or grow (for 34%) which is very similar to the previous survey.
Most were finding enough staff to grow their business, but 31% were not.
Email: